
Take your riders off high-risk roads for about 5% more distance.
Riders chasing the fastest route end up on busy arterials, shift after shift. One serious crash can mean an injured rider, a missed shift and a gap in your schedule. The Fleet Route-Risk Audit shows where your riders are exposed and gives them lower-risk routes they can ride tomorrow. On average, our safer routes are about 5% longer than the shortest route.
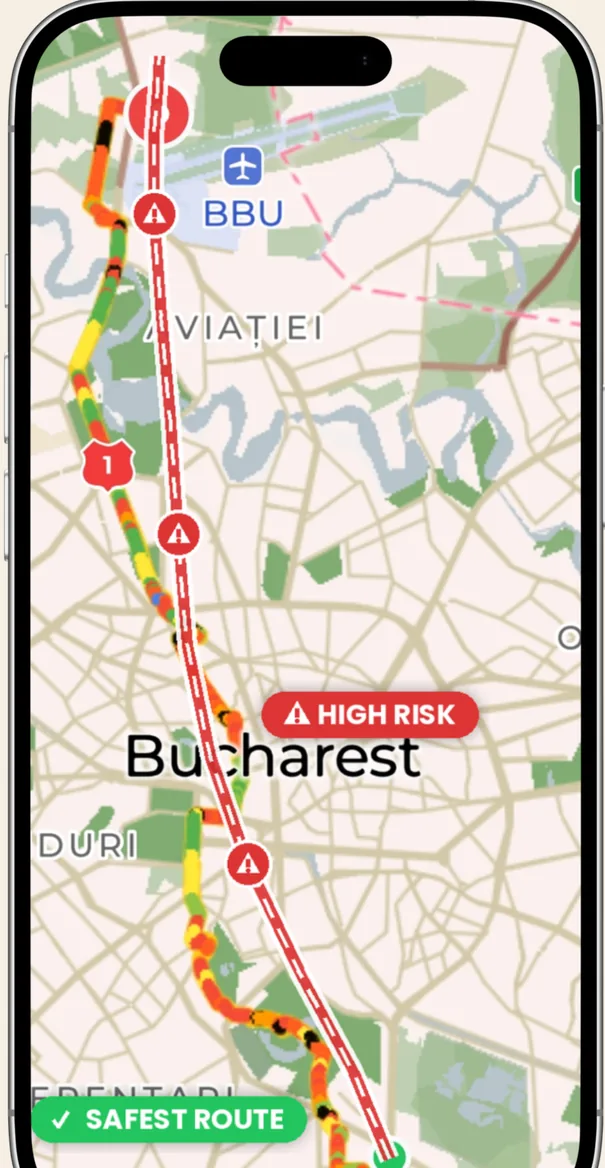
What the audit gives you
- A risk map of the streets your fleet rides most, rated Safer, Typical or High risk.
- The handful of junctions and stretches where most of the risk concentrates.
- Lower-risk alternatives for your most common trips, with the extra distance each one adds. In 10,149 test trips in Romanian cities, our routes carried lower modelled risk than Google Maps cycling directions on 99 of every 100.
Pricing is on request. Ask about launch pricing for the first fleets we audit.
On the streets the model rates High risk, serious injuries were 2.19 times as likely per passage as on the safest streets, across 2,034 counting sites in five countries. Route comparisons use modelled risk, not crash outcomes; the model predicts injury severity, not crash frequency. Method: preprint, not yet peer reviewed. Methodology →
Ask about an audit
Tell us roughly how many riders you run and where they ride most. Victor Rotariu, the founder, replies himself, in English or Romanian. Send the short form and you can pick a time for a call straight away.
Prefer email? victor@defensivepedal.com